How to Benchmark Company Performance Using Filings
How to Benchmark Company Performance Using Filings

Benchmarking company performance using filings is defined as the systematic extraction and comparison of standardized financial metrics and qualitative disclosures from SEC filings to evaluate corporate performance against peers. The primary sources are 10-K annual reports and 10-Q quarterly reports, both freely available through SEC EDGAR since 1994. Two distinct approaches apply: quantitative benchmarking using XBRL-tagged financial data, and qualitative benchmarking of narrative sections like MD&A and risk factors. Tools such as the Company Facts API, the Frames endpoint, and EDGAR Full-Text Search give analysts the infrastructure to execute both approaches at scale.
What are the essential SEC filings and data sources for benchmarking?
SEC EDGAR is the authoritative starting point for any benchmarking workflow. Every public company files 10-Ks and 10-Qs electronically, and both documents contain audited financials, management commentary, and risk disclosures in a standardized structure. That standardization is what makes cross-company comparison defensible.
The key data sources and endpoints you need to know:
-
10-K filings: Annual reports containing full-year audited financials, MD&A, and risk factors. The primary source for longitudinal performance metrics from filings.
-
10-Q filings: Quarterly reports with unaudited financials and updated management commentary. Critical for tracking intra-year trends and quarterly filing analysis.
-
EDGAR Full-Text Search (EFTS): Searches the full text of all filings by keyword, form type, and date range. The primary tool for qualitative, narrative benchmarking across peers.
-
Company Facts endpoint: Returns all XBRL-tagged financial facts for a single company in JSON format, organized by taxonomy (us-gaap, dei). Best for longitudinal analysis of one company.
-
Frames endpoint: Returns one XBRL concept’s value across all companies for a single period. Best for cross-sectional peer snapshots.
-
CIK identifiers: Every company has a unique Central Index Key. All API calls require the CIK, and formatting errors are a frequent source of failed requests.
Pro Tip: Before building any benchmarking pipeline, compile your peer group’s CIK numbers from EDGAR’s company search and store them in a reference table. This single step prevents the most common workflow failures downstream.
How to quantitatively benchmark financial metrics using XBRL data

The Company Facts endpoint returns all standardized financial facts for a company in JSON, organized by taxonomies like us-gaap. This makes it the right tool for building a full financial history of any individual company. The Frames endpoint, by contrast, returns one tag’s value for one quarter or year across all companies. That distinction determines which endpoint you use for each benchmarking task.
A practical workflow for constructing comparable quantitative datasets:
-
Define your peer group. Select companies by SIC code, market cap range, or revenue tier. Retrieve their CIK numbers from EDGAR.
-
Select your XBRL tags. Identify the us-gaap tags for the metrics you need: "Revenues
,NetIncomeLoss,OperatingIncomeLoss,EarningsPerShareBasic`. Build a fallback list for each concept in case a company uses a non-standard tag. -
Pull Company Facts data. Query the Company Facts endpoint for each CIK to retrieve full financial histories. Filter results by
formtype (10-K or 10-Q) andfileddate to isolate the periods you need. -
Derive quarterly values from 10-Q data. 10-Q flow items are YTD cumulative, meaning Q3 revenue includes Q1 and Q2. Subtract the prior period’s YTD value to get the quarter-only figure. Skipping this step produces materially overstated quarterly metrics.
-
Use Frames for cross-sectional snapshots. When you need one metric across all peers for a single period, the Frames endpoint is faster than looping through individual Company Facts calls.
-
Deduplicate for amendments. Companies file 10-K/A and 10-Q/A amendments. Keep only the most recently filed value for each period-end date to avoid double-counting restated figures.
| Endpoint | Best use case | Limitation |
|---|---|---|
| Company Facts | Full financial history, one company | Requires looping across peers |
| Frames | One metric, all companies, one period | Single concept per call only |
| EFTS | Narrative text search across filings | No structured financial data |
Pro Tip: Zero-pad every CIK to 10 digits before any API call. Apple’s CIK is 0000320193, not 320193. A missing zero returns a 404 error and breaks automated pipelines silently.
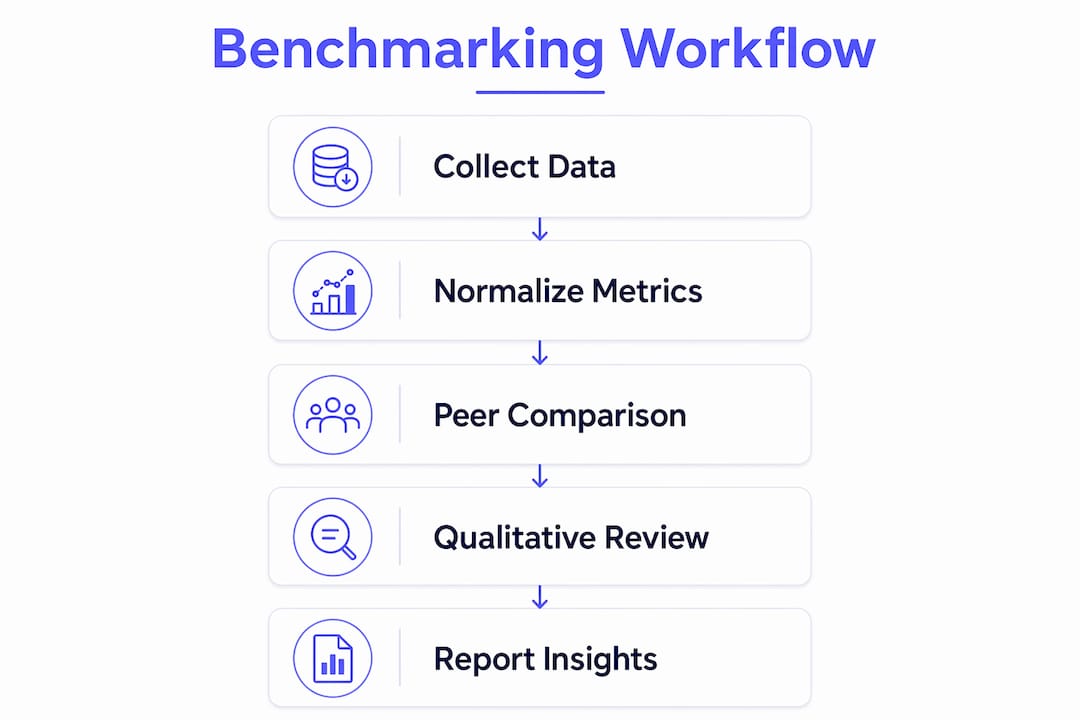
Standardization bottlenecks limit benchmarking more than data access does. The Company Facts endpoint reduces company-specific tag noise by normalizing disclosures to us-gaap taxonomy, but you still need fallback tag lists to capture historical data when companies switch tags after accounting standard changes.
How to benchmark qualitative disclosures like MD&A and risk factors
Qualitative benchmarking means comparing the language, structure, and specificity of narrative sections across peers. The MD&A section and risk factors are the two highest-value targets. Disclosure teams use EDGAR to benchmark language depth and structure before drafting, which produces more complete and SEC comment-resistant filings. Investment analysts use the same technique to assess how candidly management discusses operational challenges relative to peers.
The process for narrative benchmarking:
-
Define your peer group by SIC code. EDGAR’s full-text search filters by SIC, so you can retrieve all 10-K filings from direct industry peers within a specific date range.
-
Use EFTS for targeted language retrieval. Search for exact phrases or concepts (“supply chain disruption,” “revenue recognition,” “going-concern”) across peer filings to see how frequently and specifically peers address each topic.
-
Extract sections systematically. Tools like edgartools support a two-phase search workflow: query EFTS to identify relevant filings, then use document-level text extraction to pull the specific MD&A or risk factor section from each filing.
-
Build a comparison grid. Place verbatim excerpts from each peer’s MD&A side by side. Assess narrative drivers, quantitative specificity, and forward-looking language. This grid becomes a citable reference for investment memos.
Benchmarking MD&A narrative structure before finalizing an investment thesis surfaces gaps in management transparency that financial ratios alone cannot detect. A company reporting strong revenue growth while providing vague MD&A language around margin compression is a pattern worth flagging. The role of MD&A in filings is precisely to explain what the numbers mean, and thin disclosure is itself a data point.
Pro Tip: Focus qualitative benchmarking on specific disclosure questions rather than generic metric presence. Ask: “How specifically does each peer explain gross margin decline?” rather than “Does the MD&A mention margins?” Specific questions produce citable, decision-relevant findings.
What tools and workflows can make benchmarking from filings more efficient?
Manual benchmarking across a 15-company peer group can consume several days of analyst time. The right tooling compresses that to hours. Three categories of tools address different parts of the workflow.
Structured data extraction tools handle the XBRL pipeline. SEC-MCP supports automated standardized financial extraction, validation, ratio calculations, and side-by-side peer comparison with AI-powered features. It reduces the manual coding required to query the Company Facts and Frames endpoints correctly.
Narrative analysis platforms handle the qualitative side. Finrep’s Grid Reports compress multi-day manual review into automated grids that display peer disclosure language side by side with direct draft positioning. For analysts who need to assess disclosure quality at scale, this format is significantly faster than reading individual filings sequentially.
Integrated platforms like Filingsiq combine both functions. Filingsiq processes 10-K and 10-Q filings through AI summarization, extracts key financials, flags risk factor changes, and surfaces management commentary in a structured workspace per ticker. For portfolio managers tracking 20 or more positions, this kind of organized SEC filings research infrastructure is the difference between systematic coverage and reactive reading.
A repeatable benchmarking workflow should include:
-
A documented peer group definition with SIC code, size criteria, and CIK reference table
-
Separate pipelines for quantitative (XBRL) and qualitative (EFTS) data
-
A deduplication step that retains only the most recent filing per period
-
A standardized output format (spreadsheet or database table) that supports period-over-period comparison
-
Assigned ownership for each section of the analysis to prevent gaps in coverage
Pro Tip: Run your benchmarking workflow on one company end-to-end before scaling to the full peer group. Catching CIK formatting errors, YTD conversion mistakes, and tag gaps on a single company saves hours of debugging across 15.
What are common mistakes when benchmarking company performance using filings?
The most consequential errors in filing-based benchmarking are not conceptual. They are operational, and they compound silently across large datasets.
-
YTD flow item errors: Q2 revenue in a 10-Q includes Q1. Analysts who treat the reported figure as a standalone quarter overstate performance by the prior period’s contribution. Always subtract the prior YTD value.
-
XBRL tag inconsistency: Companies switch XBRL tags when accounting standards change. A pipeline querying only
Revenueswill miss years when a company reported underRevenueFromContractWithCustomerExcludingAssessedTax. Maintain ordered fallback tag lists for every concept. -
Ignoring amendments: A 10-K/A filed three months after the original 10-K contains restated figures. Pulling data by filing date without filtering for the latest amendment produces stale numbers.
-
Inconsistent period alignment: Fiscal year-end dates vary across companies. Comparing Apple’s September fiscal year to Microsoft’s June fiscal year without adjustment introduces timing distortions in growth rate calculations.
-
Unpadded CIK values: A raw numeric CIK without 10-digit zero-padding causes API failures. This error is trivial to fix but frequently overlooked in automated scripts.
Defensible benchmarking requires reconciling XBRL time semantics, converting YTD cumulative values in 10-Qs to quarter-only metrics for accurate temporal comparison. Pipelines that skip this step produce results that look precise but are structurally incorrect.
For SEC filing analysis best practices, document every data transformation step. When a portfolio manager questions a metric, you need to trace it back to the exact filing, period, and XBRL tag without rebuilding the analysis from scratch.
Key takeaways
Effective benchmarking of company performance using SEC filings requires combining XBRL-based quantitative extraction with structured qualitative analysis of narrative disclosures, supported by documented, repeatable pipelines.
| Point | Details |
|---|---|
| Use the right endpoint for each task | Company Facts suits longitudinal analysis; Frames suits cross-sectional peer snapshots. |
| Convert YTD values in 10-Qs | Subtract prior quarter YTD figures to derive accurate quarter-only flow metrics. |
| Maintain XBRL tag fallback lists | Companies change tags over time; fallback lists prevent gaps in historical financial data. |
| Benchmark narrative disclosures specifically | Target MD&A and risk factors with precise disclosure questions, not generic keyword presence. |
| Document every pipeline step | Traceable transformations make benchmarking results defensible and reproducible. |
Why most analysts underuse qualitative benchmarking
The quantitative side of filing-based benchmarking gets most of the attention, and I understand why. XBRL data is structured, the APIs are documented, and the output is a spreadsheet you can model. But in my experience, the qualitative side is where the real differentiation happens.
When I compare MD&A sections across a peer group, I am not just checking whether management mentioned a risk. I am assessing how specifically they quantified it, whether they explained the mechanism, and whether their language changed materially from the prior year. A company that shifts from specific, quantified risk language to vague, boilerplate disclosure is signaling something. That signal does not appear in any financial ratio.
The challenge is that qualitative benchmarking at scale requires discipline. You need a defined peer group, a specific set of disclosure questions, and a consistent extraction method. Without that structure, you end up reading filings impressionistically rather than analytically. Tools like EDGAR Full-Text Search and Filingsiq’s narrative extraction features make the structured approach feasible without requiring a team of analysts.
My practical advice: start every benchmarking project by writing down three to five specific questions you want the disclosures to answer. Then build your extraction workflow around those questions. The specificity forces you to design a process that produces citable, decision-relevant output rather than a pile of text excerpts.
— Matthew
How Filingsiq accelerates your benchmarking workflow

Filingsiq is built for analysts who need to evaluate corporate performance across multiple filings without spending days on manual extraction. The platform processes 10-K and 10-Q filings through AI summarization, pulling key financials, risk factor changes, and MD&A commentary into a structured workspace for each ticker. Side-by-side peer comparison is built in, so you can assess performance metrics from filings across your entire coverage universe in one view. Filingsiq also flags accounting irregularities and disclosure changes automatically, reducing the risk of missing material shifts between periods. If you are building or refining a filing-based benchmarking workflow, Filingsiq cuts research time significantly while improving the consistency of your output. See the platform pricing to find the plan that fits your coverage needs.
FAQ
What SEC filings are most useful for benchmarking company performance?
The 10-K and 10-Q are the primary filings for financial benchmarking, providing audited annual financials and quarterly updates respectively. Both are freely available through SEC EDGAR and contain structured XBRL data alongside narrative disclosures.
What is the difference between the Company Facts and Frames endpoints?
The Company Facts endpoint returns the full financial history of one company across all XBRL tags, while the Frames endpoint returns one tag’s value across all companies for a single period. Use Company Facts for longitudinal analysis and Frames for cross-sectional peer snapshots.
Why do 10-Q financial figures require adjustment before benchmarking?
10-Q flow items like revenue and operating income are reported on a year-to-date cumulative basis. To get quarter-only values, you must subtract the prior quarter’s YTD figure from the current one. Skipping this step overstates quarterly performance.
How do you benchmark qualitative disclosures across peers?
Use EDGAR Full-Text Search to retrieve peer filings filtered by SIC code and form type, then extract specific sections like MD&A and risk factors for side-by-side comparison. Focus on specific disclosure questions rather than generic keyword searches for citable results.
What is the most common technical error in XBRL-based benchmarking?
Failing to zero-pad CIK identifiers to 10 digits is the most frequent operational error, causing API request failures. A second common error is treating YTD cumulative 10-Q values as standalone quarterly figures without applying the required subtraction.
Recommended
Related insights
Ready to analyze filings faster?
Try FilingsIQ free and turn SEC filings into actionable research in minutes.