How Annual Report Analysis Works for Investors
How Annual Report Analysis Works for Investors

Annual report analysis is the systematic examination of a company’s financial and strategic disclosures to assess business performance and investment potential. Finance professionals and individual investors rely on this process to cut through corporate narrative and reach the numbers that actually matter. A standard annual report runs 150–300 pages, which makes knowing where to focus the most valuable skill you can develop. The SEC requires public companies to file a 10-K annually, and that document contains the MD&A, audited financial statements, risk factor disclosures, and notes to financial statements. Mastering how annual report analysis works separates investors who react to headlines from those who act on evidence.
What are the core sections of an annual report?
Five sections deliver the majority of investment insight in any annual report. Knowing what each one reveals lets you read with purpose rather than patience.
-
Management Discussion and Analysis (MD&A): This section is management’s own narrative of the business. It covers revenue drivers, competitive positioning, and forward-looking strategy. The MD&A often contains the clearest signals of a company’s competitive advantage and pricing power. Look for terms like “market share,” “switching costs,” and “pricing power” as indicators of a durable moat.
-
Financial Statements: The income statement, balance sheet, and cash flow statement form the quantitative core of any annual report breakdown. These three documents, read together, reveal profitability, solvency, and cash generation.
-
Notes to Financial Statements: The footnotes disclose accounting policies, debt covenants, segment performance, and revenue recognition methods. Analysts who skip the notes miss the details that often explain why headline numbers look the way they do.
-
Risk Factors: This section lists potential threats to the business. Risk disclosures are often boilerplate, so prioritize risks that are specific to the company rather than generic industry language. Customer concentration above 20% of revenue, for example, is a material and company-specific risk worth flagging.
-
Letter to Shareholders: The shareholder letter reveals management’s tone, honesty, and long-term thinking. Compare what management promised last year with what actually happened. Consistency between promises and results is a strong signal of credible leadership.
Pro Tip: Read the shareholder letter from three years ago before reading the current one. You will immediately see whether management’s projections matched reality.
How do you interpret key financial statements for investment insights?
The three financial statements answer three distinct questions: Did the company make money? What does it own and owe? Did it generate real cash?
Income statement: revenue quality and margins
The income statement shows revenue, gross profit, operating income, and net income. Gross margin trends reveal pricing power and cost control. A company with expanding gross margins while growing revenue is demonstrating genuine competitive strength. Net income alone tells an incomplete story because accrual accounting allows companies to recognize revenue before cash arrives.
Balance sheet: assets, liabilities, and leverage
The balance sheet shows what a company owns and owes at a single point in time. The debt-to-equity ratio measures financial leverage. A 2:1 debt-to-equity ratio signals high leverage and elevated financial risk, particularly in rising interest rate environments. The current ratio measures short-term liquidity. A current ratio above 1.0 confirms the company can cover near-term obligations without distress.

Cash flow statement: the most reliable signal
The cash flow statement is the hardest section to manipulate. Operating cash flow and free cash flow trends reveal true business health better than accrual-based net income figures. Free cash flow is operating cash flow minus capital expenditures. A company that reports growing net income but declining free cash flow deserves close scrutiny.
| Metric | What it measures | Warning threshold |
|---|---|---|
| Current ratio | Short-term liquidity | Below 1.0 |
| Debt-to-equity | Financial leverage | Above 2.0 |
| Return on equity (ROE) | Profitability efficiency | Declining over 3 years |
| Free cash flow | Real cash generation | Negative while net income is positive |
| Gross margin | Pricing power and cost control | Compressing year over year |
Key financial ratios such as ROE, profit margins, and free cash flow deliver the majority of investment insight from financial statements. Tracking these five metrics across multiple reporting periods gives you a reliable picture of financial trajectory without reading every line of a 200-page document.
Pro Tip: When net income rises but operating cash flow falls, search the notes for changes in accounts receivable or deferred revenue. That gap usually has a specific accounting explanation.
What are important qualitative and red flag considerations?
Annual reports serve a marketing function as well as a disclosure function. Disclosures are accurate but crafted to cast the company in the most favorable light possible. That reality requires you to read with healthy skepticism, not cynicism.
The auditor’s opinion is the first place to check for problems. A clean, unqualified opinion is standard. A qualified or adverse auditor opinion is a major red flag indicating potential systemic financial issues. Going-concern language in the auditor’s report means the auditor doubts the company’s ability to survive the next 12 months. That single phrase warrants immediate and deep investigation before any investment decision.
Watch for these specific warning signs when conducting your annual report breakdown:
-
Income and cash flow divergence: Negative operating cash flow despite positive net income is a classic signal of earnings manipulation or aggressive revenue recognition.
-
Accounting policy changes: Mid-period changes to depreciation methods or revenue recognition, disclosed in the footnotes, can inflate reported earnings without improving actual performance.
-
Unusual related-party transactions: Transactions between the company and its executives or major shareholders at non-market terms deserve scrutiny. These appear in the notes and are easy to overlook.
-
Inconsistent trend breaks: A sudden jump or drop in a metric that had been stable for years requires an explanation. If management does not explain it clearly in the MD&A, that silence is itself informative.
For a deeper look at identifying filing red flags, the pattern of inconsistencies across sections matters as much as any single data point.
“Investors must balance quantitative data with qualitative context, avoiding blind reliance on reported profits alone. The auditor’s report is a succinct but powerful indicator of report reliability; adverse opinions should prompt deep caution.”
One of the most common value investing mistakes is treating a strong income statement as sufficient evidence of financial health without cross-referencing the cash flow statement and auditor’s opinion.
How to perform practical, efficient annual report analysis
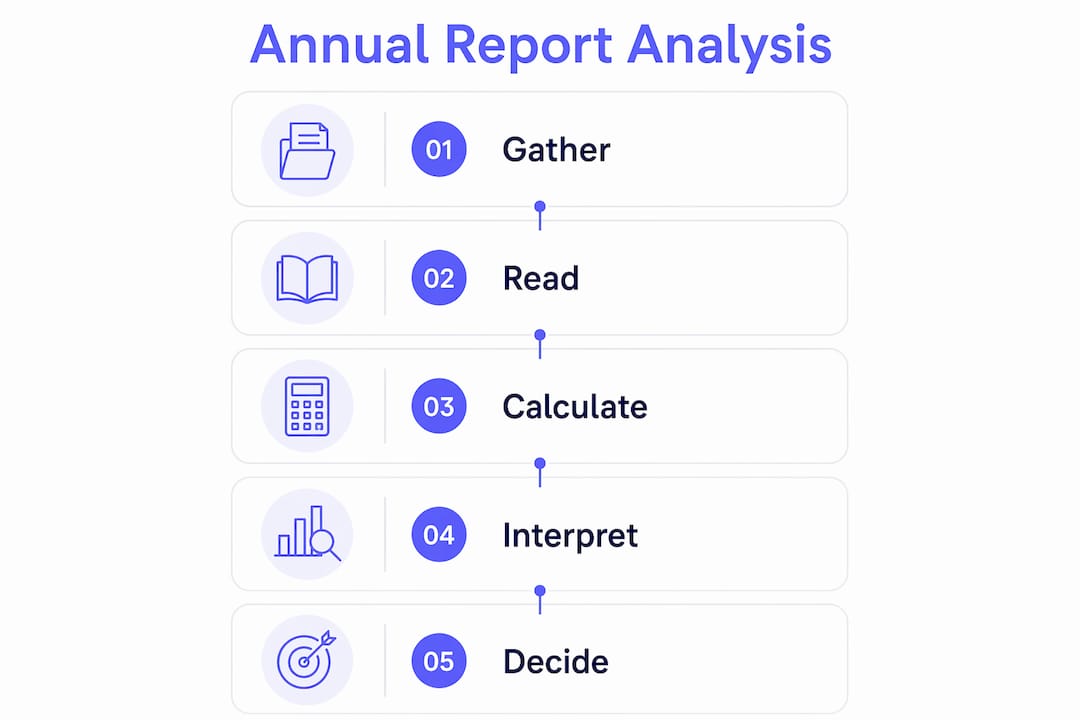
Efficient analysis is not about reading less. It is about reading the right sections in the right order with clear benchmarks in mind. The following sequence works for most investment research workflows.
-
Start with the auditor’s opinion. A clean opinion clears the path. Any qualification stops your analysis until you understand the issue.
-
Read the shareholder letter and MD&A together. These two sections give you management’s narrative. Note the specific claims about competitive position, growth drivers, and capital allocation priorities.
-
Pull five years of key metrics. Analyzing at least 3–5 years of annual reports reveals trends that a single year cannot show. Revenue growth, margin trajectory, and free cash flow consistency are the three most telling multi-year patterns.
-
Apply ratio benchmarks to the financial statements. Use the five ratios in the table above as your initial filter. Flag any metric outside its historical range or below industry norms.
-
Read the risk factors for company-specific threats. Skip the boilerplate. Focus on risks that name specific customers, regulators, or technologies. These are the disclosures that carry real investment weight.
-
Cross-reference the notes with the income statement. If revenue grew sharply, check whether accounts receivable grew faster. If operating expenses fell, confirm no major accounting policy change drove the reduction.
-
Form a qualitative judgment on management credibility. Compare this year’s MD&A claims with last year’s results. Consistent, honest communication from management is a qualitative moat that financial ratios cannot capture.
Pro Tip: Build a simple spreadsheet tracking five key metrics across five years for every company you analyze. The visual trend line reveals more than any single year’s figures.
For analysts who want a structured framework for SEC filing best practices, applying a consistent methodology across every report prevents the selective reading that leads to biased conclusions.
Key Takeaways
Annual report analysis works by combining structured section reading, ratio benchmarking, and qualitative judgment to assess a company’s true financial health and investment potential.
| Point | Details |
|---|---|
| Focus on five core sections | MD&A, financial statements, notes, risk factors, and the shareholder letter cover most of what you need. |
| Cash flow beats net income | Operating and free cash flow reveal business health more reliably than accrual-based earnings. |
| Auditor opinion is your first check | A qualified or adverse opinion signals systemic risk and requires investigation before proceeding. |
| Multi-year trends outperform snapshots | Analyzing 3–5 years of data exposes trajectory that a single annual report cannot show. |
| Skepticism is a required skill | Annual reports are crafted to favor the company; cross-referencing sections catches inconsistencies. |
Why annual report analysis still demands human judgment
Annual report analysis has never been more accessible, and yet the failure rate among individual investors who rely on it has not meaningfully improved. The reason is not a lack of data. It is a lack of discipline in how that data gets interpreted.
The most common mistake I see is anchoring on net income. Analysts read a strong earnings number and stop there. The cash flow statement, which is far harder to manipulate, tells a different story in a surprising number of cases. I have reviewed filings where net income grew for three consecutive years while free cash flow quietly deteriorated. The stock looked cheap on a price-to-earnings basis right up until the company announced a liquidity problem.
The footnotes are the other consistently underread section. Accounting policy changes buried in note 2 or note 3 can shift reported earnings by material amounts without changing the business at all. Revenue recognition policy changes are particularly common in technology and software companies. If you are not reading the notes, you are not reading the report.
The qualitative dimension matters just as much as the numbers. Management teams that consistently overpromise and underdeliver show that pattern clearly when you compare MD&A language across years. Honest management teams acknowledge setbacks directly. That distinction does not show up in any ratio, but it is one of the most reliable predictors of long-term investment outcomes I have encountered.
Annual report analysis is not a task you complete. It is a discipline you practice. The investors who do it well combine financial rigor with genuine curiosity about how a business actually operates.
— Matthew
Filingsiq makes annual report analysis faster and more accurate
Reading a 250-page 10-K thoroughly takes hours, and the risk of missing a critical footnote or cash flow inconsistency is real. Filingsiq addresses that problem directly.

Filingsiq’s AI-driven SEC filings platform extracts key financials, risk factors, and MD&A insights from 10-Ks and 10-Qs in minutes. The platform flags accounting irregularities, going-concern language, and changes in risk disclosures automatically, so you spend your time on judgment rather than document hunting. Each ticker gets a dedicated workspace that organizes findings across filings and reporting periods. For RIAs and portfolio managers who cover dozens of companies, that efficiency compounds quickly. Learn more about how Filingsiq works and see how AI-assisted analysis fits your research workflow.
FAQ
What is annual report analysis?
Annual report analysis is the structured review of a company’s 10-K or equivalent filing to assess financial health, management quality, and investment risk. It covers financial statements, MD&A, risk factors, auditor opinions, and footnotes.
Which section of an annual report matters most?
No single section is sufficient on its own, but the cash flow statement and the auditor’s opinion together provide the most reliable and manipulation-resistant signals of financial health.
How many years of annual reports should I analyze?
Analyzing 3–5 years of filings reveals trends in revenue growth, margin trajectory, and cash flow consistency that a single year cannot show.
What are the biggest red flags in an annual report?
A qualified or adverse auditor opinion, negative operating cash flow alongside positive net income, and unexplained accounting policy changes in the footnotes are the three most serious warning signs to investigate immediately.
How does AI help with annual report analysis?
AI-powered tools like Filingsiq summarize lengthy filings, flag red flags automatically, and extract key metrics across multiple periods, reducing research time without sacrificing analytical depth.
Recommended
-
SEC Filing Analysis Best Practices for Analysts | FilingsIQ.ai
-
How to Analyze a 10-K Filing: A Practical Guide for RIAs and Investment Analysts | FilingsIQ.ai
-
The Role of MD&A in Filings: An Analyst’s Guide | FilingsIQ.ai
-
The MD&A Section Explained: What RIAs Need to Know (And What to Look For) | FilingsIQ.ai
Related insights
Ready to analyze filings faster?
Try FilingsIQ free and turn SEC filings into actionable research in minutes.