How to Evaluate Stock Before Investing: Filing Guide
How to Evaluate Stock Before Investing: Filing Guide

Evaluating stock before investing through SEC filings is the most direct method for assessing a company’s financial health, risk profile, and management credibility. The SEC’s EDGAR database publishes 10-K annual reports, 10-Q quarterly updates, 8-K material event disclosures, DEF 14A proxy statements, and Form 4 insider transaction filings. Each document type serves a distinct analytical purpose. Tools like Filingsiq now allow analysts to process these documents in minutes rather than hours, but the underlying methodology for reading filings remains the same. This guide covers what to review, how to read it, and where analysts most often go wrong.
What tools and documents you need to evaluate stock filings
Efficient filing analysis starts with knowing which documents to pull and in what order. The SEC’s EDGAR database is the authoritative source for all public company filings, and every document discussed here is available free of charge. Filingsiq.ai adds an AI summarization layer on top of EDGAR, extracting key financial metrics, risk disclosures, and MD&A highlights into structured summaries.
Primary filing types to review
-
10-K (Annual Report): Filed under penalty of perjury, the 10-K provides audited financial statements, full risk factor disclosures, and management commentary. It is more authoritative than any investor relations document a company publishes voluntarily.
-
10-Q (Quarterly Report): Unaudited but filed quarterly, the 10-Q captures material changes between annual filings. Analysts who skip 10-Qs miss the first signals of deteriorating performance.
-
8-K (Current Report): Filed within four business days of a material event, the 8-K covers earnings releases, acquisitions, leadership changes, and credit agreement amendments.
-
DEF 14A (Proxy Statement): Contains executive compensation structures, board composition, and shareholder vote items. Governance red flags appear here first.
-
Form 4 (Insider Transactions): Insider buying or selling provides directional signals about management’s confidence in the company’s near-term prospects.
Useful data tools and methods
| Tool or Method | Primary Use |
|---|---|
| SEC EDGAR full-text search | Locate specific disclosures across all filings |
| Change-diff / delta comparison | Isolate year-over-year amendments in risk factors and MD&A |
| Filingsiq AI summarizer | Extract key financials, risks, and management tone in minutes |
| Market data integration | Triangulate filing disclosures with price, volume, and consensus data |
Pro Tip: Use AI summarization tools like Filingsiq for an initial pass to flag sections worth reading in depth, but always verify material claims against the original EDGAR filing. AI tools can misinterpret complex accounting language or miss context-specific nuances.
How to analyze critical sections of stock filings step by step
A focused 15 to 20 minute skim of the Risk Factors, MD&A, financial statements, and internal controls section covers most investment decisions. Full deep reads take two to four hours depending on company complexity. The following sequence maximizes signal per minute spent.
-
Read the Risk Factors section first. Scan for newly added or removed disclosures. Newly added risk factors are disproportionately informative because legal counsel drafts them carefully under personal liability, signaling that management has identified a material change in the company’s risk environment.
-
Evaluate the MD&A narrative. The MD&A section is the highest-signal component of any filing because it contains management’s own interpretation of performance. Assess whether the language is factual and specific or defensive and vague. Defensive language around revenue shortfalls or margin compression often precedes guidance cuts.
-
Examine the financial statements and footnotes. Revenue recognition policies, lease obligations, and goodwill impairment assumptions live in the footnotes. Discrepancies between cash flow from operations and net income are primary indicators of lower earnings quality and deserve immediate scrutiny.
-
Apply the delta method. Experienced analysts focus on added, removed, or materially changed content between filing periods rather than reading each document from scratch. Compare the current 10-K risk factors section against the prior year’s version line by line. Any new paragraph warrants investigation.
-
Review critical accounting estimates. Changes in depreciation schedules, revenue recognition timing, or reserve assumptions can shift reported earnings materially without triggering a restatement. These disclosures appear in both the footnotes and the MD&A.
-
Check Form 4 filings for insider activity. Cluster selling by multiple executives within a short window is a meaningful warning signal. Conversely, open-market purchases by insiders at current prices indicate conviction.
Pro Tip: Prioritize Risk Factors and MD&A in every analysis session. These two sections deliver the highest concentration of forward-looking, management-verified intelligence per page. Financial statements confirm what the narrative sections signal.
How to interpret risk disclosures and financial metrics in filings
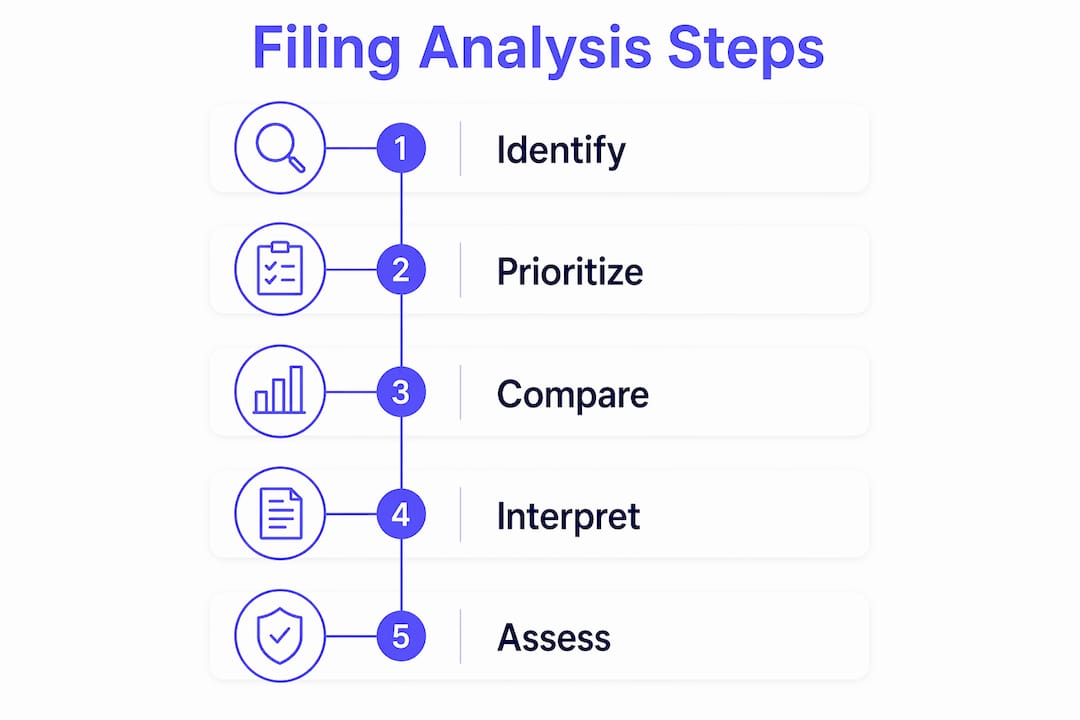
Understanding stock financials from filings requires distinguishing between boilerplate language and genuinely new disclosures. Boilerplate risk factors appear in nearly every filing within an industry and carry minimal analytical weight. New or substantially revised risk factors carry significant weight because of the legal liability attached to them.

Financial health indicators to check
Three financial metrics consistently separate high-quality businesses from deteriorating ones. First, revenue growth consistency across segments matters. A discrepancy greater than 200 basis points between reported total revenue growth and segment-level data often indicates accounting aggressiveness or underlying business friction that headline numbers obscure. Second, free cash flow conversion relative to net income reveals earnings quality. Third, debt maturity schedules in the footnotes expose refinancing risk that balance sheet summaries do not.
Risk signal comparison table
| Risk Signal | What It Implies |
|---|---|
| New risk factor added | Management has identified a material, previously undisclosed threat |
| Going-concern opinion from auditor | Solvency risk is material; requires immediate further diligence |
| Related-party transaction increase | Potential governance conflict; verify terms against market rates |
| Revenue growth vs. segment data gap | Possible accounting aggressiveness or segment deterioration |
| Auditor change without explanation | Elevated risk of financial reporting disagreement |
Governance disclosures in the DEF 14A and 10-K often reveal related-party transactions, audit committee composition, and executive compensation structures tied to short-term metrics. These factors affect the reliability of reported financials and the alignment between management and shareholder interests.
Pro Tip: After completing your filing analysis, assess whether current valuation reflects the risks you identified. A fundamentally sound business can still be a poor investment if priced for perfection. Filing analysis tells you what the business is; valuation discipline tells you what you should pay for it.
What pitfalls to avoid when analyzing stock investment documents
The most common error analysts make is treating AI-generated summaries as a substitute for primary source review. AI tools that automate SEC filing summaries save significant time but must be verified against source documents because of possible hallucinations or misinterpretations of complex accounting language. Use AI for triage, not for final judgment.
Additional pitfalls that undermine filing analysis quality include:
-
Skipping 10-Q filings in favor of only the annual 10-K. Quarterly filings capture material deterioration months before the annual report reflects it. A company can report a strong 10-K in February and file a 10-Q in May that reveals a collapsing revenue trend.
-
Misreading legal language in risk factors. Legal drafting is precise. “May” and “could” carry different weight than “will” and “has.” Treating all risk language as equivalent boilerplate causes analysts to miss material disclosures.
-
Glossing over financial statement footnotes. Revenue recognition policy changes, contingent liabilities, and off-balance-sheet arrangements appear in footnotes, not in the primary statements. Analysts who skip footnotes miss the real story.
-
Information overload without a structured process. A 10-K for a large-cap company can exceed 200 pages. Without the delta method and a section-priority framework, analysts spend time on low-signal content and miss high-signal changes.
Triangulate your filing findings with earnings call transcripts and current market data. Management tone on earnings calls often confirms or contradicts what you read in the MD&A. When the two diverge, the filing is the more legally reliable source.
Reading primary filings directly uncovers information lost in third-party summaries and provides a genuine analytical edge for investors who invest the time. Source: Fundamentals of SEC Filings Analysis
Pro Tip: Maintain a standardized checklist for each ticker that tracks Risk Factors, MD&A tone, cash flow quality, insider activity, and auditor opinion across filing periods. A repeatable process prevents the cognitive shortcuts that cause analysts to miss material changes.
Key takeaways
Evaluating stock filings before investing requires a structured, section-priority approach that combines the delta method, risk factor analysis, and financial statement scrutiny to surface material changes before they reach consensus.
| Point | Details |
|---|---|
| Start with risk factors | Newly added disclosures signal material threats; read them before financials. |
| Apply the delta method | Compare current and prior filings to isolate non-boilerplate changes efficiently. |
| Verify AI summaries | Cross-check AI-generated insights against original EDGAR filings to avoid misinterpretation. |
| Check cash flow vs. net income | Divergence between the two is the primary indicator of lower earnings quality. |
| Pair analysis with valuation | A sound business at an extreme valuation is still a poor investment decision. |
What I’ve learned from years of reading filings directly
The analysts I respect most share one habit: they read the primary source. Summaries, analyst reports, and earnings recaps all filter information through someone else’s judgment. The filing is the only document where management is legally accountable for every word.
The delta method changed how I approach every new filing. Before I adopted it, I was reading 10-Ks linearly and spending most of my time on sections that hadn’t changed in three years. Now I go straight to the diff. If a risk factor paragraph was added or substantially rewritten, I want to know why before I read anything else. That single change in workflow cut my per-filing analysis time significantly while improving the quality of what I found.
The other insight I’d push back on conventional wisdom about: most analysts treat the MD&A as a narrative summary of the financials. It is not. Management’s MD&A narrative reveals competitive pressures and market repositioning more reliably than headline numbers. When a CFO spends three paragraphs explaining why a metric should be viewed on an “adjusted” basis, that is a signal, not a disclosure.
Finally, I’d caution against the temptation to stop at filing analysis. Combining filing analysis with valuation discipline maximizes investment success. The filing tells you what the business is. The price tells you what the market thinks it’s worth. Both inputs are required for a sound decision.
— Matthew
How Filingsiq accelerates your filing analysis workflow
Filingsiq is built specifically for the workflow described in this guide. The platform’s AI reads 10-K, 10-Q, and 8-K filings and surfaces structured summaries of risk factors, MD&A highlights, and financial metrics within minutes of a filing hitting EDGAR. It flags newly added risk disclosures, detects changes in auditor language, and integrates real-time market data so you can move from filing review to investment decision without switching between tools.

For analysts managing multiple tickers, Filingsiq creates a dedicated workspace per company that tracks filing history and highlights material changes across periods. This is the delta method, automated. If you want to see how the platform handles a specific filing, the AI filing analysis tool is available to explore directly. For a detailed breakdown of the workflow, the how it works page covers the full process from filing ingestion to risk scoring.
FAQ
What is the most important section to read in a 10-K?
The Risk Factors section and MD&A deliver the highest concentration of forward-looking, management-verified intelligence. Newly added risk factors are particularly informative because legal liability makes their inclusion deliberate.
How often should I review stock filings for a position I hold?
Review 10-Q filings within one to two weeks of each quarterly release and read the full 10-K annually. Material 8-K filings should be reviewed within 24 to 48 hours of publication.
Can AI tools replace manual filing analysis?
AI tools accelerate triage and surface key sections faster, but they must be verified against original filings. Possible hallucinations or misinterpretations of complex accounting language make human review of material claims necessary.
What does the delta method mean in filing analysis?
The delta method involves comparing the current filing directly against the prior period version to isolate added, removed, or materially changed content. This approach focuses analyst attention on what actually changed rather than what remained static.
How do I identify accounting red flags in SEC filings?
Look for discrepancies between cash flow from operations and net income, changes in revenue recognition policies, auditor opinion qualifications, and related-party transaction increases. These signals, taken together, indicate lower earnings quality or governance risk.
Recommended
Related insights
Ready to analyze filings faster?
Try FilingsIQ free and turn SEC filings into actionable research in minutes.