How to Screen Sectors Using SEC Disclosures
How to Screen Sectors Using SEC Disclosures
Screening sectors using SEC disclosures is a systematic process of extracting and analyzing public company filings to assess sector performance, competitive dynamics, and material risk factors. The core documents are the Form 10-K, Form 10-Q, and Form 8-K, supported by critical sections including the MD&A, risk factors, and segment reporting governed by ASC 280. For investment professionals, this process replaces guesswork with structured, audited evidence. Done correctly, it produces a repeatable workflow that surfaces sector-level signals before they appear in price action.
What are the essential SEC filings and disclosure sections to monitor for sector screening?
The Form 10-K is the foundation of any sector analysis. It contains audited financials, a full MD&A, and a risk factor section that companies must update annually. The Form 10-Q provides quarterly updates, making it the primary source for tracking intra-year shifts in revenue mix, margin pressure, and working capital. The Form 8-K captures material events in real time, from executive departures to supply chain disruptions.
Within those filings, four sections carry the most weight for sector screening:
-
MD&A: Management’s discussion of results, trends, and forward-looking factors. Trade-related impacts such as tariff-induced cost increases and supply chain shifts are increasingly embedded here as both qualitative commentary and quantitative disclosures.
-
Risk factors: Companies disclose material risks relevant to their sectors in this section, focusing on risks “to which reasonable investors would attach importance.” Reading across a peer group reveals which risks are sector-wide versus company-specific.
-
Segment reporting (ASC 280): Governs how companies break out revenue and operating income by business unit. This section is the most direct source of sub-sector performance data.
-
Legal proceedings and market risk: These sections flag regulatory exposure and interest rate or commodity sensitivity that often define sector-level risk profiles.
Recent SEC disclosure trends show increased focus on quantifying tariff impacts and operational challenges within MD&A and financial statements. That shift means analysts who read only the income statement miss the real story on cost structure.
How to extract and analyze sector insights from SEC filings effectively?
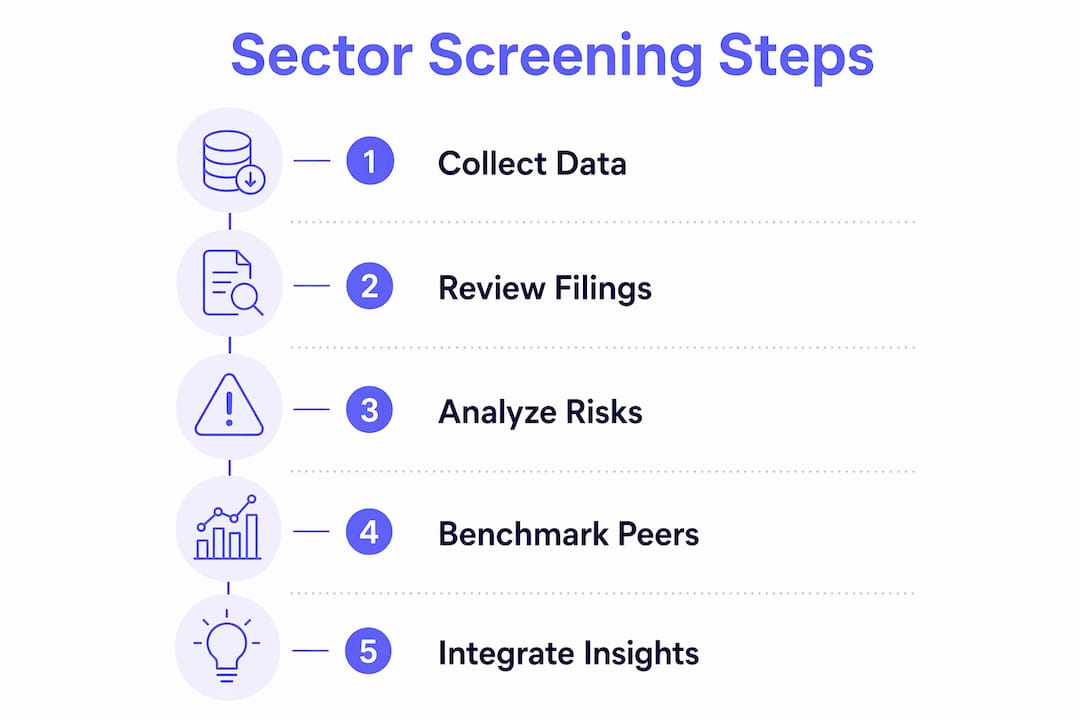
A structured extraction workflow separates useful sector signals from noise. Follow these steps to build a repeatable process:
-
Define your peer group. Select 8–15 public companies within the target sector using SIC codes or GICS classifications. Consistency in peer selection is the single biggest driver of benchmark quality.
-
Filter by filing type and date range. Use EDGAR’s full-text search to pull 10-Ks and 10-Qs for a consistent trailing period, typically four to eight quarters.
-
Parse MD&A and risk factors systematically. Read these sections across all peer companies before reviewing financials. Patterns in language, such as repeated references to “pricing pressure” or “labor availability,” signal sector-level conditions rather than company-specific issues.
-
Extract financial benchmarks. Focus on revenue per employee, capex intensity, SG&A as a percentage of revenue, and segment revenue margins. Analysts use SEC filings to calibrate these public-company benchmarks, then test them against broader economic datasets to verify representativeness.
-
Flag segment reporting gaps. ASC 280 requires segment disclosure only when a segment exceeds 10% of total revenues. Smaller divisions may be aggregated, which can obscure sub-sector performance.
-
Track 8-K filings for emerging signals. Material event disclosures often precede quarterly filings by weeks. Building an 8-K alert system for your peer group gives you an early-warning layer.
AI-powered filing intelligence tools are transforming how analysts filter and benchmark SEC data, creating faster and more granular sector screening workflows. Workiva’s AI-driven knowledge bases, for example, allow analysts to filter filings by type and date range and compare target companies against a peer group in a fraction of the time manual review requires.
Pro Tip: When comparing risk factor sections across a peer group, track language changes year over year. A new risk category appearing across multiple companies in the same quarter is a leading indicator of sector-level stress.

What tools and data sources complement SEC filings for sector screening accuracy?
SEC filings cover public companies only. EDGAR data excludes the majority of small and medium-sized private companies, which means analysts relying solely on public filings may draw conclusions from an unrepresentative sample. Integrating federal economic databases closes that gap.
The most useful complementary sources are:
-
Census Bureau’s County Business Patterns (CBP): Provides establishment counts, employment, and payroll by industry at the county level. CBP data lets you size the private-firm portion of a sector and assess market concentration.
-
BLS Quarterly Census of Employment and Wages (QCEW): Covers employment and wage structure across all employer types. Comparing QCEW wage trends to MD&A labor cost disclosures reveals whether a sector’s cost pressure is broad or isolated to public companies.
-
FRED (Federal Reserve Economic Data): Contextualizes sector performance against interest rates, industrial production indices, and credit conditions. A sector showing margin compression in 10-Ks looks very different when FRED data shows rising input costs across the entire economy.
For ESG screening, a multi-step approach starts with 10-K risk sections, then integrates sustainability reports and third-party assessments like MSCI and Sustainalytics to verify material claims. You can find a detailed breakdown of how to combine these sources in this ESG disclosures guide.
ESG ratings are useful inputs for screening but vary in methodology. Analysts should verify material sector-specific issues directly from company disclosures and independent audits rather than treating third-party scores as definitive. CDP responses and sustainability reports add qualitative depth that 10-K risk sections alone do not provide.
The table below shows how each data source maps to a specific screening gap:
| Data source | Primary use in sector screening |
|---|---|
| SEC EDGAR (10-K, 10-Q, 8-K) | Public company financials, risk factors, segment performance |
| Census Bureau CBP | Private firm market structure and establishment density |
| BLS QCEW | Sector-wide employment and wage trends |
| FRED | Macroeconomic context for sector performance |
| MSCI / Sustainalytics / CDP | ESG risk verification and sector materiality |
What are the best practices and common mistakes when screening sectors using SEC disclosures?
Effective sector screening requires discipline in both process and interpretation. The following practices separate rigorous analysis from surface-level reads:
-
Standardize your workflow before you start. Define which sections you extract, which metrics you calculate, and which thresholds trigger a flag. Consistency across companies and time periods is what makes comparisons valid. Review SEC filing analysis best practices to build a structured template.
-
Build peer groups deliberately. Mixing companies with different fiscal year ends or reporting currencies introduces noise. Align your peer group on these dimensions before benchmarking.
-
Use AI filtering tools to handle volume. A sector screen covering 15 companies across eight quarters means reviewing 120 filings. AI-powered platforms cut that time significantly while flagging language changes and anomalies that manual review misses.
-
Validate SEC data against external sources. Integrating SEC filing data with broader economic datasets is the standard practice among rigorous analysts. A benchmark built only on public filings may overstate sector profitability if large private competitors operate at lower margins.
-
Watch for delayed and amended filings. NT 10-K and NT 10-Q filings signal that a company could not meet its reporting deadline. That pattern, especially across multiple companies in a sector, is itself a risk signal worth investigating.
-
Interpret risk factor disclosures for materiality, not volume. Companies sometimes pad risk sections with boilerplate language. Focus on risks that are new, quantified, or described with greater specificity than in prior periods.
Pro Tip: Set up EDGAR alerts for 8-K filings across your entire peer group. When multiple companies in a sector file 8-Ks within the same two-week window, a sector-level event is almost always the cause. That pattern surfaces faster than any quarterly filing.
For analysts who want to go deeper on benchmarking company performance using filings, the methodology for deriving financial and operational benchmarks from SEC data is worth reviewing before building your first sector model.
The real value of SEC disclosures in sector screening has shifted
When I started working with SEC filings, the standard approach was to pull the income statement, check the segment footnote, and move on. The risk factor section was treated as legal boilerplate. That approach no longer holds up.
Since 2024, the granularity of risk disclosures has increased meaningfully. Companies are now quantifying tariff exposure, describing supply chain restructuring in operational terms, and flagging cybersecurity risks with specificity that was rare two years ago. That shift means the risk factor section is now one of the highest-signal parts of any filing for sector analysis.
AI tools have changed the efficiency equation entirely. What used to take a team of analysts several days, reading through peer group filings and manually tagging themes, now takes hours with the right platform. The bottleneck has moved from data gathering to interpretation. That is actually a harder problem, because it requires judgment about what the disclosures mean for sector dynamics, not just what they say.
The private company gap remains the most underappreciated limitation in SEC-based sector screening. In sectors where private firms hold significant market share, such as construction, agriculture, and professional services, a screen built entirely on EDGAR data can produce a fundamentally misleading picture of competitive intensity and margin norms. Pairing EDGAR with CBP and QCEW data is not optional for those sectors. It is the minimum standard for credible analysis.
ESG integration is maturing, but the verification problem has not been solved. Third-party ratings from MSCI and Sustainalytics are useful starting points, but sector materiality varies enormously. An environmental risk that is material for an energy company may be irrelevant for a software firm. Always anchor ESG screening to the specific risk factors disclosed in the 10-K before applying external ratings.
— Matthew
How Filingsiq makes sector screening faster and more accurate
Analysts who screen industries using SEC data face a volume problem. Reviewing dozens of filings across a peer group manually is slow and prone to inconsistency.

Filingsiq’s AI-driven platform addresses that directly. It summarizes 10-Ks and 10-Qs in minutes, structures risk factor disclosures for cross-company comparison, and flags changes in language between filing periods. You get the key financials, management insights, and red flags without reading every page. For portfolio managers and RIAs who need to evaluate sectors quickly and with confidence, see how Filingsiq works to understand how the platform fits into a professional screening workflow.
Key takeaways
Screening sectors using SEC disclosures produces the most reliable results when analysts combine structured filing extraction with complementary economic data and AI-assisted comparison tools.
| Point | Details |
|---|---|
| Prioritize MD&A and risk factors | These sections now contain quantified tariff, supply chain, and operational risk data that financials alone do not capture. |
| Apply ASC 280 segment limits carefully | Segments below 10% of total revenue are not required to be disclosed separately, which can hide sub-sector performance. |
| Integrate EDGAR with federal economic data | Census CBP and BLS QCEW data fill the private-company gap that EDGAR cannot address on its own. |
| Use AI tools to handle filing volume | AI-powered platforms reduce peer group review time from days to hours and surface language changes automatically. |
| Validate ESG ratings against 10-K disclosures | Third-party ESG scores vary by methodology; anchor them to company-specific risk factor language before drawing conclusions. |
FAQ
What SEC filings are most useful for sector screening?
The Form 10-K, Form 10-Q, and Form 8-K are the primary filings for sector analysis. The 10-K provides annual audited data and full risk disclosures, the 10-Q tracks quarterly shifts, and the 8-K captures material events in real time.
How does ASC 280 affect sector analysis using SEC disclosures?
ASC 280 requires companies to disclose segment data only when a segment exceeds 10% of total revenues. Smaller business units are often aggregated, which can obscure the performance of sub-sectors within a diversified company.
Why should analysts combine SEC filings with Census and BLS data?
EDGAR covers public companies only. Combining SEC data with Census Bureau County Business Patterns and BLS wage data gives analysts a complete picture of sector structure, including the private firms that public filings exclude.
How do I use risk factor disclosures to evaluate sectors?
Read risk factor sections across your entire peer group and flag risks that are new, quantified, or described with greater specificity than in prior periods. Risks appearing across multiple companies simultaneously signal sector-level conditions rather than company-specific issues.
What role does AI play in screening industries using SEC data?
AI-powered platforms parse and compare filings across large peer groups, flag language changes between periods, and extract key financial metrics automatically. That reduces the time required for a full sector screen from days to hours while improving consistency across the analysis.
Recommended
Related insights
Ready to analyze filings faster?
Try FilingsIQ free and turn SEC filings into actionable research in minutes.